

Tanzu Kubernetes Grid
Monitoring Services
Together, Prometheus and Grafana provide a powerful monitoring and visualization platform for Kubernetes clusters The Tanzu Kubernetes Grid platform from VMware provides these applications as add-on services which can be easily deployed within a TKG environment. While the add-on packages are available, most organizations will likely want to modify the installation of these applications to provide front-end ingress services, persistent storage, and other modifications. This article will demonstrate how to install Prometheus and Grafana into a TKG workload cluster that leverage both a front-end httpproxy through NSX Advanced Load Balancer and persistent storage for the data layers of both applications.
The YAML files leveraged in this article are available on the Virtual Elephant Github repository: virtualelephant/tkg-monitoring
Prometheus is an open-source monitoring and alerting system that is designed to collect metrics from various sources and store them in a time-series database. It is particularly well-suited for monitoring containerized environments like Kubernetes, where application are often composed of multiple microservices that are constantly changing.
In a Kubernetes cluster, Prometheus is typically deployed as a set of containers that run alongside the application containers. The following YAML file will configure and deploy Prometheus inside a TKG workload cluster:
https://github.com/virtualelephant/tkg-monitoring/blob/main/prometheus-tkg.yaml
apiVersion: v1
kind: PersistentVolumeClaim
metadata:
  name: prometheus-pvc
spec:
  accessModes:
    - ReadWriteMany
  storageClassName: ""
  resources:
    requests:
      storage: 150Gi
  volumeName: prometheus-pv
---
apiVersion: v1
kind: PersistentVolume
metadata:
  name: prometheus-pv
spec:
  capacity:
    storage: 150Gi
  accessModes:
    - ReadWriteMany
  nfs:
    path: /opt/persistent/prometheus
    server: services.home.virtualelephant.com
---
apiVersion: v1
kind: Service
metadata:
  name: prometheus
  labels:
    app: prometheus
spec:
  type: ClusterIP
  ports:
  - port: 9090
    name: web
  selector:
    app: prometheus
---
apiVersion: apps/v1
kind: Deployment
metadata:
  name: prometheus
  labels:
    app: prometheus
spec:
  replicas: 1
  selector:
    matchLabels:
      app: prometheus
  template:
    metadata:
      labels:
        app: prometheus
    spec:
      containers:
      - name: prometheus
        image: prom/prometheus
        ports:
        - containerPort: 9090
        volumeMounts:
        - name: prometheus-data
          mountPath: /prometheus
        command:
        - "/bin/prometheus"
        args:
        - "--config.file=/etc/prometheus/prometheus.yml"
        - "--storage.tsdb.path=/prometheus"
      volumes:
      - name: prometheus-data
        persistentVolumeClaim:
          claimName: prometheus-pvc
      - name: prometheus-config
        configMap:
          name: prometheus-configmap
---
apiVersion: projectcontour.io/v1
kind: HTTPProxy
metadata:
  name: prometheus
  labels:
    app: prometheus
spec:
  virtualhost:
    fqdn: prometheus.home.virtualelephant.com
  routes:
    - services:
      - name: prometheus
        port: 9090
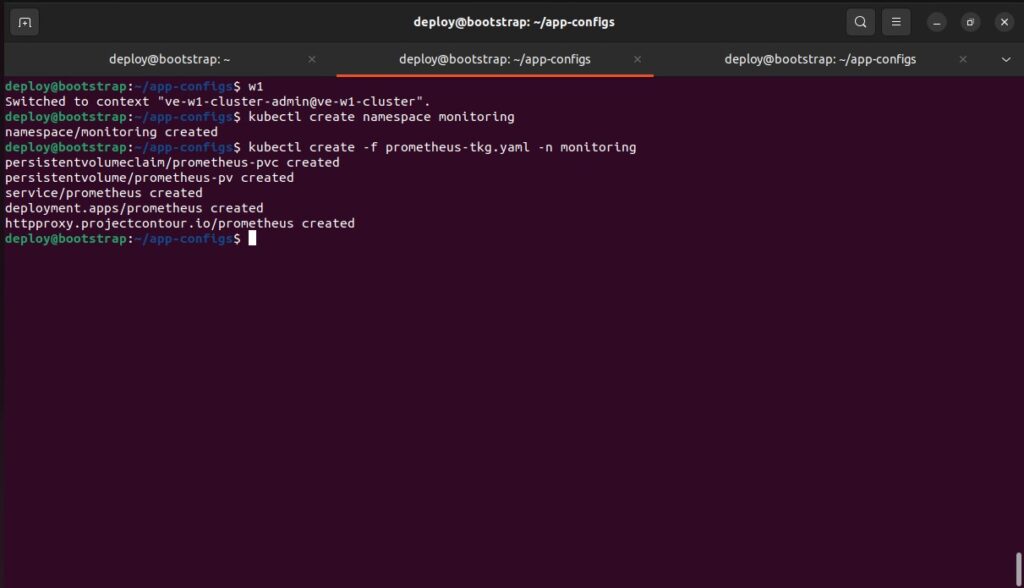
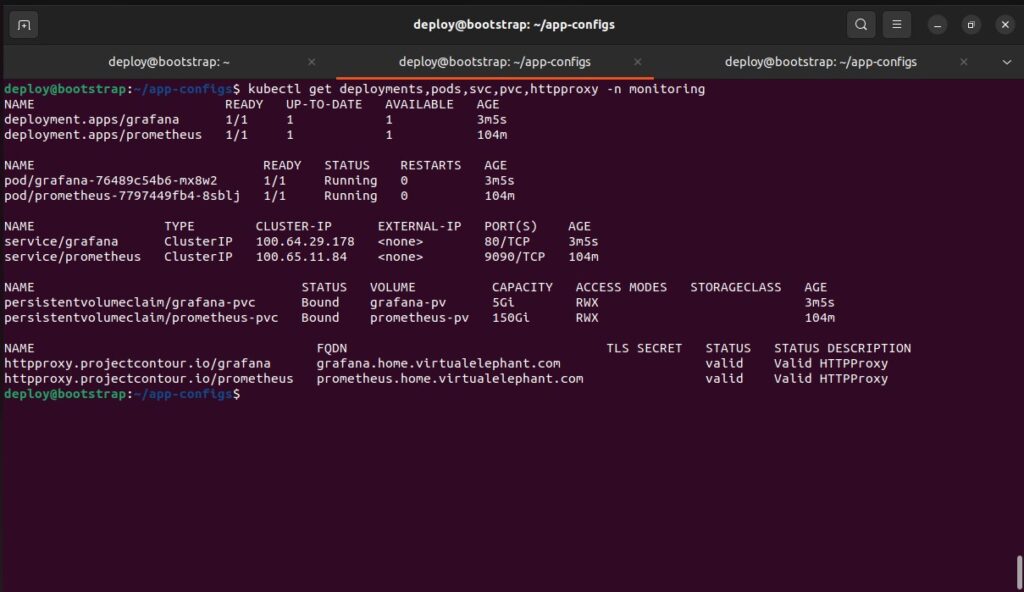
bootstrap $ kubectl create namespace monitoring
bootstrap $ kubectl create -f prometheus-tkg.yaml -n monitoring
Grafana is an open-source data visualization and monitoring platform that is designed to work with a variety of data sources, including Prometheus. Grafana provides a web-based interface for creating and sharing dashboards that display metrics collected by Prometheus and other sources. In a Kubernetes cluster, Grafana is typically deployed as a separate container or set of containers that run alongside the Prometheus containers. The following YAML file will deploy Grafana within a Kubernetes cluster:
https://github.com/virtualelephant/tkg-monitoring/blob/main/grafana-tkg.yaml
apiVersion: v1
kind: PersistentVolumeClaim
metadata:
  name: grafana-pvc
spec:
  accessModes:
    - ReadWriteMany
  storageClassName: ""
  resources:
    requests:
      storage: 5Gi
  volumeName: grafana-pv
---
apiVersion: v1
kind: PersistentVolume
metadata:
  name: grafana-pv
spec:
  capacity:
    storage: 5Gi
  accessModes:
    - ReadWriteMany
  nfs:
    path: /opt/persistent/grafana
    server: services.home.virtualelephant.com
---
apiVersion: apps/v1
kind: Deployment
metadata:
  name: grafana
spec:
  selector:
    matchLabels:
      app: grafana
  replicas: 1
  template:
    metadata:
      labels:
        app: grafana
    spec:
      containers:
      - name: grafana
        image: grafana/grafana:latest
        ports:
        - containerPort: 3000
        volumeMounts:
        - name: grafana-storage
          mountPath: /var/lib/grafana
      volumes:
      - name: grafana-storage
        persistentVolumeClaim:
          claimName: grafana-pvc
---
apiVersion: v1
kind: Service
metadata:
  name: grafana
spec:
  selector:
    app: grafana
  type: ClusterIP
  ports:
  - name: grafana
    port: 80
    targetPort: 3000
---
apiVersion: projectcontour.io/v1
kind: HTTPProxy
metadata:
  name: grafana
  labels:
    app: grafana
spec:
  virtualhost:
    fqdn: grafana.home.virtualelephant.com
  routes:
    - services:
      - name: grafana
        port: 80
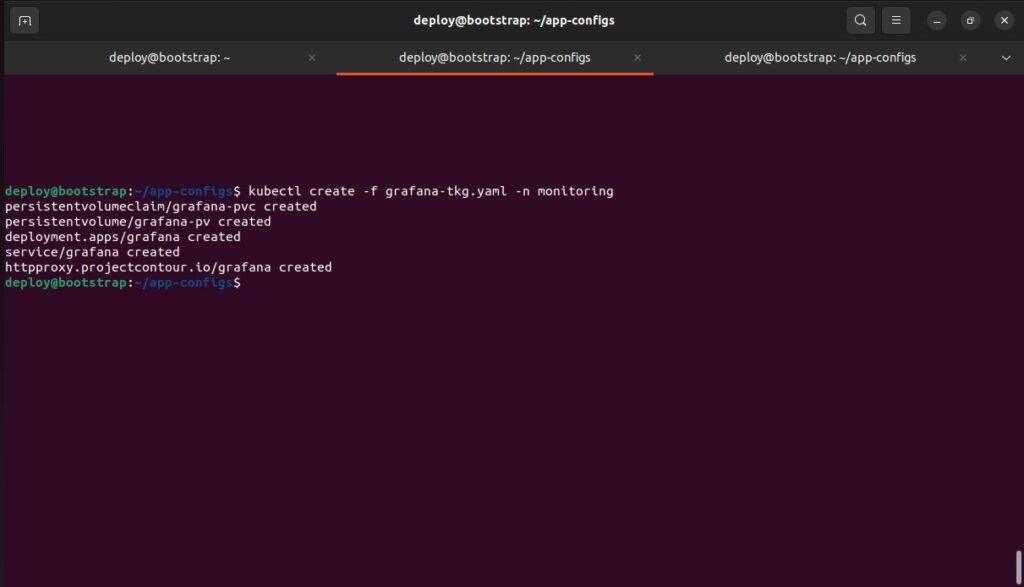
bootstrap $ kubectl create namespace monitoring
bootstrap $ kubectl create -f grafana-tkg.yaml -n monitoring
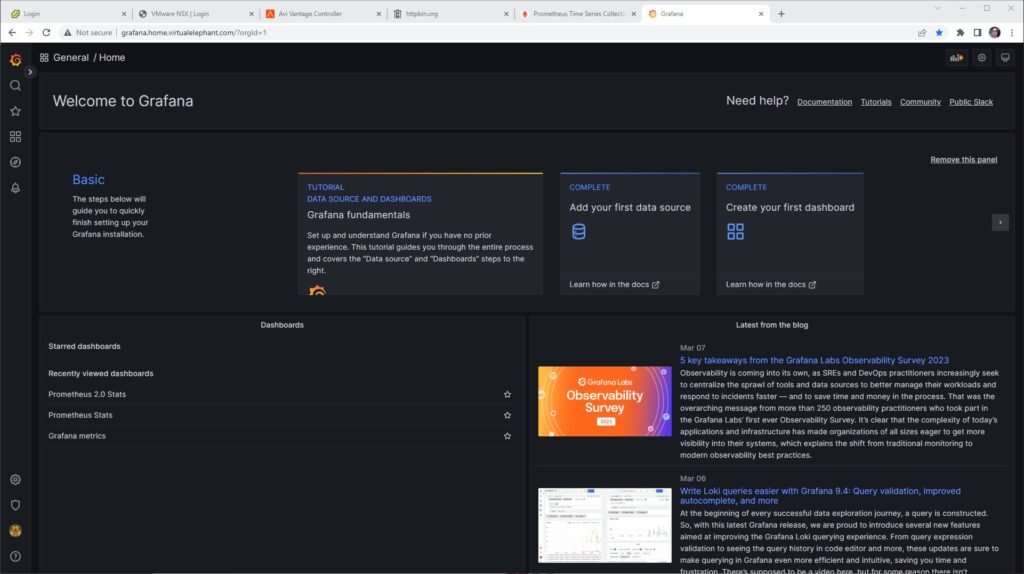
The Grafana UI can be accessed via the URL defined inside the HTTPProxy object — here it is accessible via grafana.home.virtualelephant.com.
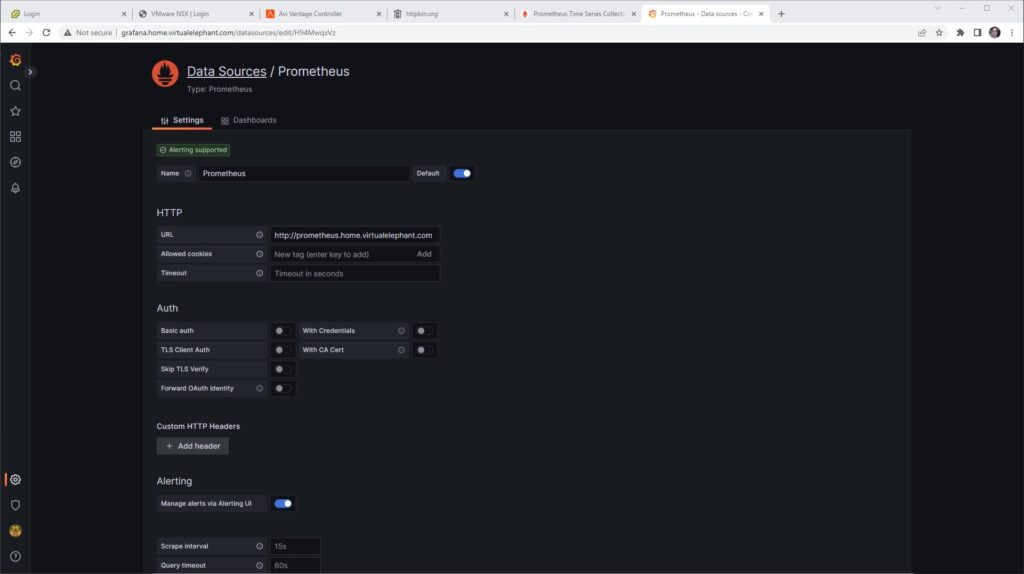
After deploying both Prometheus and Grafana inside the Kubernetes cluster, the next step in the configuration is to setup Prometheus as a data source inside Grafana. This is done by selecting the gear icon on the bottom left side of the Grafana UI and then selecting Data Sources. Fill out the URL, followed by the Prometheus Type and Prometheus Version sections of the form.
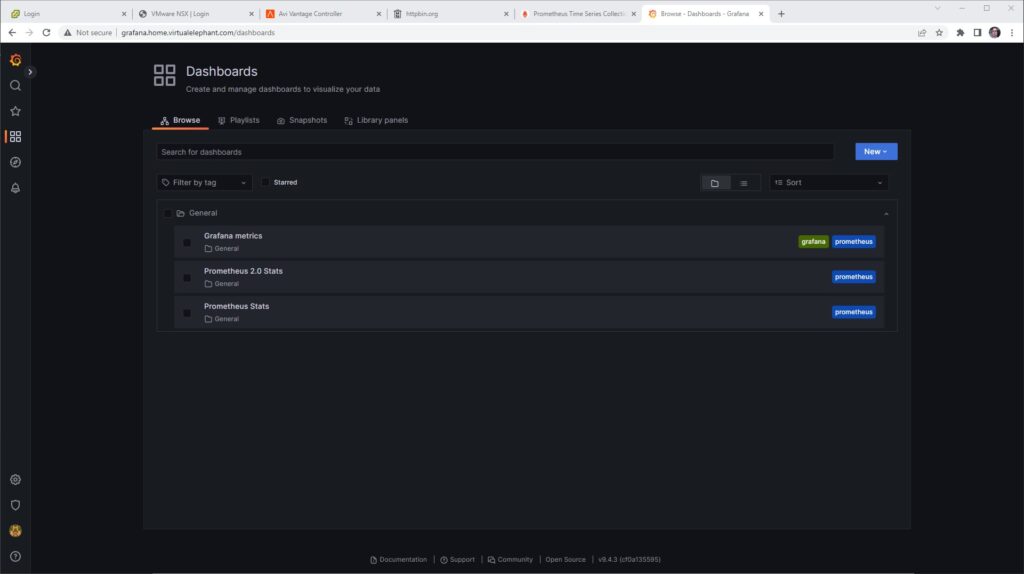
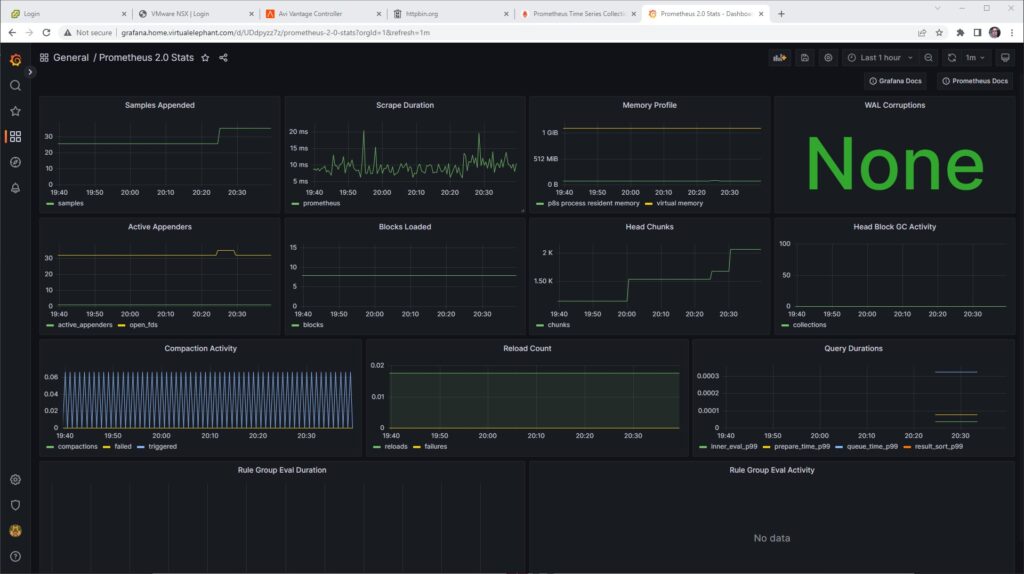
After testing the connection, you can import the Dashboards via the UI as well. After importing the Prometheus 2.0 and Grafana metrics dashboards, they will become available with the Dashboards icon on the left side of the Grafana UI.
There are a goodly number of other applications that can be deployed inside Kubernetes and leveraged as a data source for Grafana. These other applications can provide insights into the resources, configurations, and applications that are being deployed inside the Kubernetes clusters. Some examples are:
The possibilities are endless, and it really depends on what kind of data you want to visualize and what kind of applications you are using within the Kubernetes environment.